In Controlled Environment Agriculture (CEA), precise nutrient management is crucial for consistent, high-quality yields. Electrical Conductivity (EC) plays a vital role in this process, and understanding EC contributions in fertilizers can significantly enhance a cultivator's nutrient management capabilities.
EC measures a solution's ability to conduct electricity, correlating with its dissolved ion concentration. In hydroponics, EC indicates the overall nutrient concentration in feeding solutions, allowing growers to maintain optimal nutrient balance throughout plant growth phases.
EC contribution refers to the specific EC increase each fertilizer component adds to the nutrient solution. This concept is key when working with multi-part fertilizer systems to create tailored nutrient recipes. Knowledge of EC contributions enables cultivators to:
- Control nutrient concentration precisely across growth phases
- Identify and correct mixing errors quickly
- Adjust recipes easily to meet changing plant needs
- Validate stock solutions and feeding systems accurately
Front Row Ag integrates EC contribution information into our feed charts, providing a powerful nutrient management tool. These charts display usage rates (in grams per gallon or injection rate) of each input for various recipes and target ECs, along with the EC contributed by each part across different plant phases.
This article will explore the fundamentals of EC contributions, methods for measuring and calculating them, and their practical applications in commercial CEA operations. We'll discuss how EC contributions enhance stock validation, improve nutrient recipe accuracy, and contribute to more consistent crop success.
Fundamentals of EC and Nutrient Solutions
Relationship between EC and Nutrient Concentration
EC measures the ability of a solution to conduct electricity, which directly correlates with the concentration of dissolved ions. In nutrient solutions, these ions come from dissolved fertilizer salts. As the concentration of nutrients increases, so does the EC of the solution.
Front Row Ag provides feed charts in two categories to accommodate different growing environments and crop needs:
- Standard Strength: EC range of 1.6-2.6, suitable for soil, outdoor growers, large pot cultivation, and facilities with lower intensity lighting.
- High Strength: EC range of 1.8-3.0, designed for high-intensity CEA cultivation, including greenhouse and indoor hydroponics with high PPFD lighting and close monitoring of substrate EC and water content percentage.
Most Front Row Ag customers use the High Strength feed chart, reflecting the trend towards more controlled and intensive growing environments.
Factors Affecting EC Measurements
Several factors can influence EC measurements, making it essential to maintain consistent measuring conditions:
- Calibration: Regular calibration of EC meters ensures accurate readings.
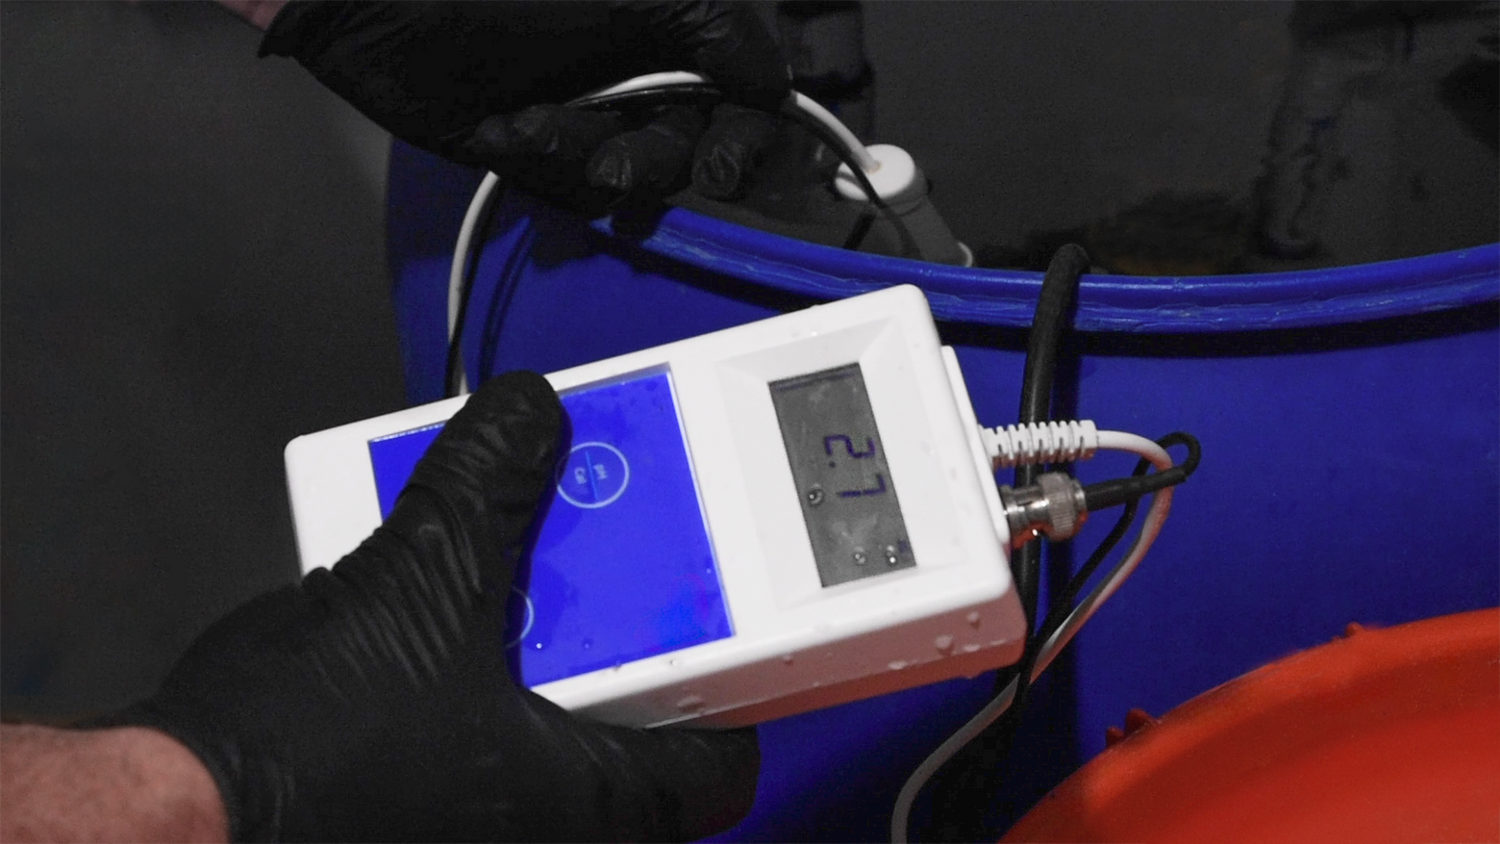
- Meter quality: Using a high-quality EC meter, such as the Myron Ultrameter 2, provides more reliable and consistent measurements.
- Solution homogeneity: Proper mixing of nutrient solutions ensures uniform EC throughout.
Water Quality in EC Calculations
The starting water quality significantly impacts EC measurements and nutrient management:
- Reverse Osmosis (RO) water: With its very low EC (typically <0.05), RO water provides a clean slate for precise nutrient formulation.
- Tap or well water: These sources may contain dissolved minerals that contribute to the base EC, requiring adjustments in fertilizer additions and calculations
Contributed EC
Contributed EC refers to the increase in EC caused by adding a specific amount of fertilizer to a solution. Key ways of showing EC contributions include:
- Contributed EC per g/gal: This metric indicates how much a single gram of fertilizer per gallon of water increases the overall EC.
- Validation EC: The expected EC when a specific volume of stock solution is diluted in a known volume of water, used for quality control.
- Contributed EC as part of a recipe: The increase in EC caused by the addition of a fertilizer input to a feed solution.
Importance of Precise and Consistent Fertilizer Manufacturing
Consistent EC contributions rely on precise fertilizer manufacturing:
- Uniform composition: Ensures that each batch of fertilizer provides the same EC contribution.
- Quality control: Regular testing of fertilizer batches maintains consistency in EC contributions.
- Accurate labeling: Provides growers with reliable information for calculating nutrient recipes.
Measuring and Calculating EC Contributions
Understanding how to measure and calculate EC contributions is crucial for precise nutrient management in controlled environment agriculture. Front Row Ag provides detailed information and tools to help growers accurately measure and apply EC contributions in their cultivation practices.

EC Contributions per gram per gallon of each part
On feed charts, Front Row Ag provides exact EC contributions per gram per gallon for each part of the fertilizer system:

Stock Rates and Validation
Front Row Ag primarily uses a 3-2-2 Stock Concentrate system.
Wondering what 3-2-2 Stock Concentrate means? 3-2-2 refers to the number of whole bags of Part A, Part B and Bloom you mix into 50 gallons of water each to create A, B, and Bloom stock concentrates. You mix three 25lb bags of Part A into 50 gallons of concentrate, two 25lb bags of Part B into 50 gallons of concentrate, and two 25lb bags of Bloom into 50 gallons of concentrate.
Here are the 3-2-2 stock rates and validation EC values:

Validation of Stock Tanks
To ensure accurate EC contributions, follow these validation instructions:
- Remove exactly 250 ml of well-mixed stock concentrate and add to 5 gallons of RO water. (Note: This is scaled up 5x from the 50 ml to 1 gallon ratio to reduce measurement error.)
- Mix thoroughly and check EC against the validation chart.
- Adjust stock concentrate strength as necessary to match the validation EC - if EC is higher than expected and solution is fully mixed, add a small volume of RO water and retest.
- Repeat this process for each stock concentrate, validating against the expected EC.
EC Contributions on Feed Charts
Here's an example of how EC contributions are applied in practice, using the Standard Strength feed chart. Notice the individual EC contributions of each part, shown in red underneath the usage rate:
 Calculating Total EC from Individual Components
The total EC of a nutrient solution is the sum of the EC contributions from each fertilizer component. As shown in the feed chart, the EC contribution of each part is provided for every recipe and growth phase, making it easy to calculate and verify total EC.
For example, in the vegetative phase for this standard strength feed chart:
- Part A contributes 1.7 EC
- Part B contributes 0.9 EC
- Bloom contributes 0 EC (not used in this phase)
- Total EC: 2.6
Recipe Design Based on EC Contributions
Front Row Ag carefully engineers each recipe to provide specific macro and micronutrient concentrations and ratios, based on the EC contributed from each part. The feed charts reflect this precise formulation, showing how the EC contributions change across different growth phases to meet the plant's changing nutritional needs.
Notice how the Bloom component's EC contribution increases in later growth stages, reflecting the changing nutritional requirements of the plant. Likewise, the Part A EC contribution decreases during “Ripen”, reflecting the drop in Nitrogen that enhances the shift to secondary metabolism and subsequent increase in metabolite production.
Common Challenges and Best Practices
When measuring and calculating EC contributions, be aware of these potential sources of error:
- Inaccurate measurement of stock solution volume
- Imprecise measurement of RO water volume
- Errors in weighing powdered fertilizer
To minimize these issues:
- Use high-quality measuring equipment, a measurement syringe is preferred for stock solutions.
- Double-check measurements
- Ensure thorough mixing of solutions
- Regularly calibrate EC meters
- Follow the scaled-up validation procedure (250 ml : 5 gallons)
Practical Applications
Knowledge of using EC contributions provides growers with powerful tools for optimizing their cultivation practices. This section explores practical applications and the numerous benefits of implementing EC contribution knowledge in commercial growing operations.
1. Dialing in Dosing Systems
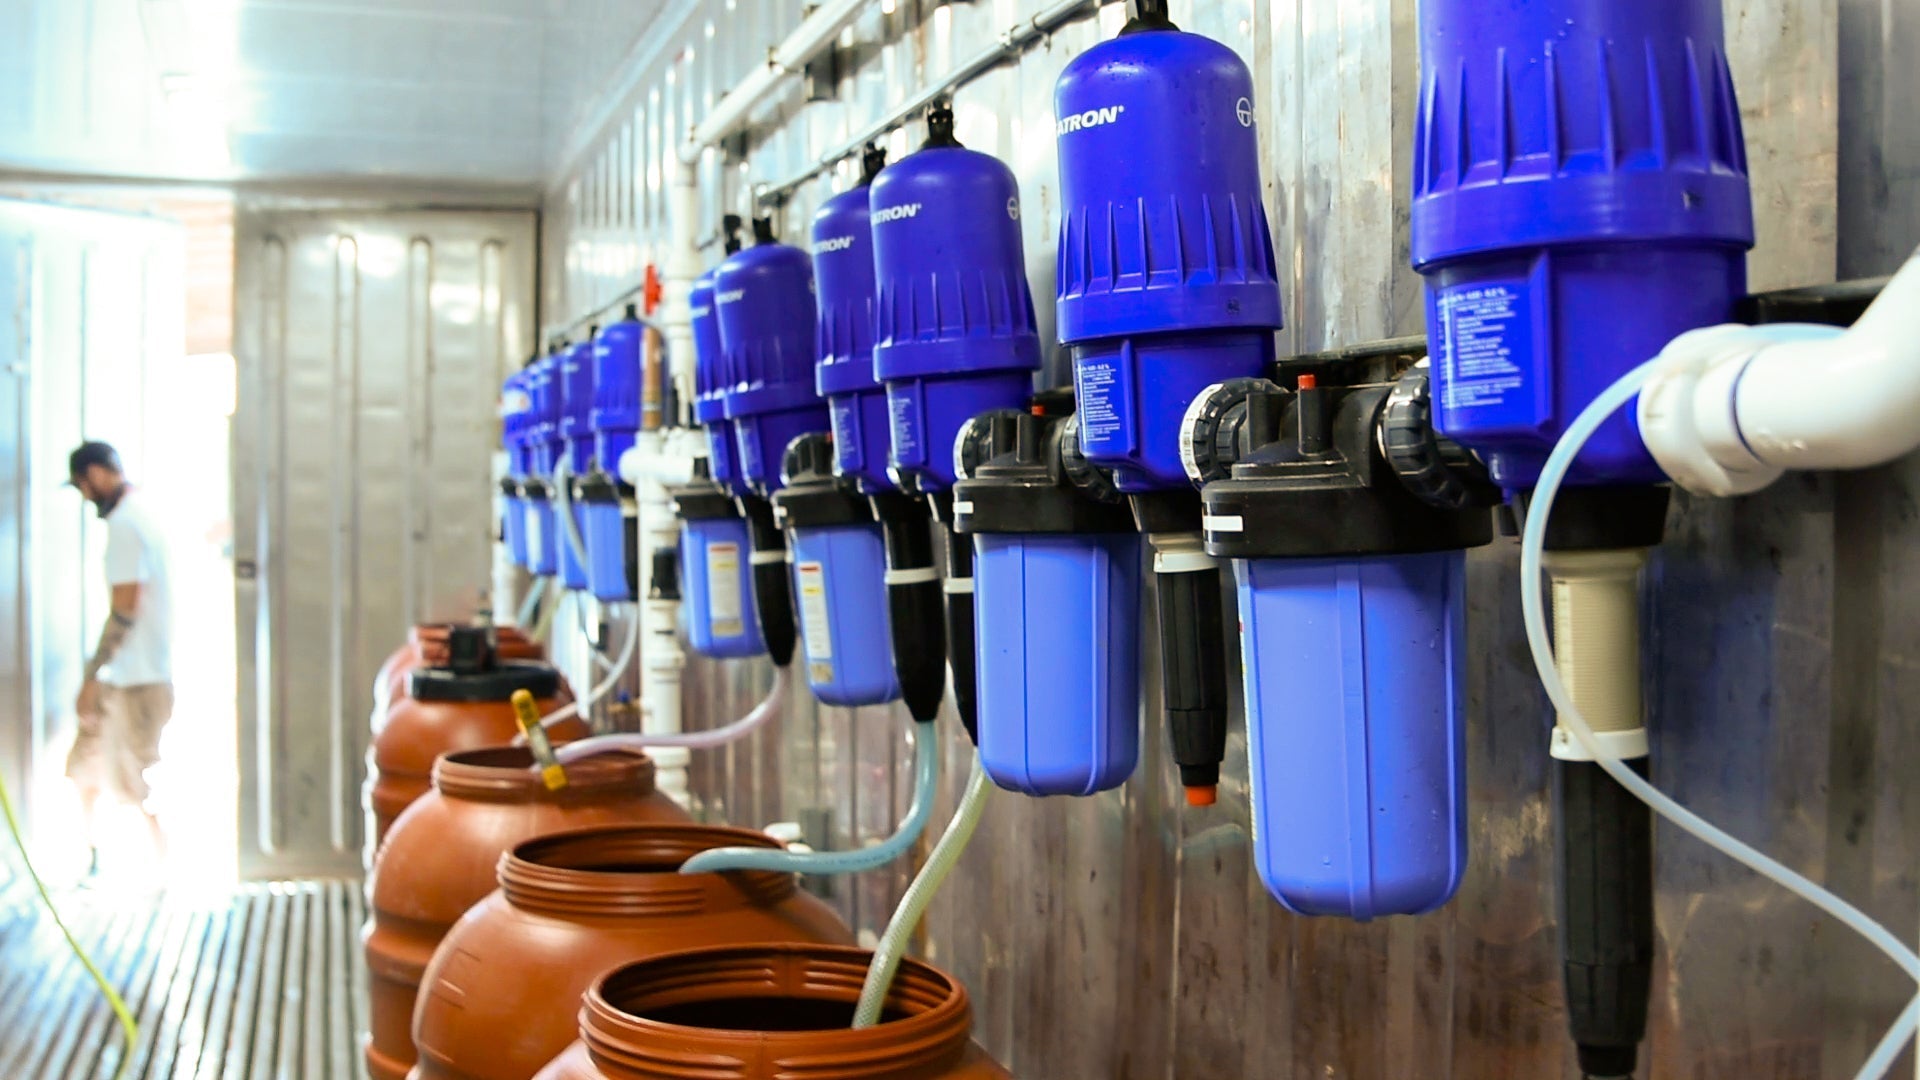
One of the most valuable applications of EC contribution knowledge is in the calibration and maintenance of dosing systems, such as dosatron panels used in fertigation.
Example: Calibrating a Dosatron Panel
- Target EC: 2.7 (Stack phase)
- Procedure:
- Run only the Part A doser for 5 gallons
- Measure EC increase (should be 1.4 EC)
- Repeat for Part B (target 0.7 EC increase)
- Repeat for Bloom (target 0.6 EC increase)
- Final solution should reach 2.7 EC
This method allows growers to:
- Detect and correct volumetric calibration issues in dosing systems
- Ensure each fertilizer component is being injected at the correct rate
- Maintain precise nutrient ratios throughout the cultivation cycle
2. Customizing Nutrient Recipes for Specific Cultivars
Understanding EC contributions enables growers to fine-tune nutrient recipes for optimal performance of different cultivars.
- Adjust individual component ratios while maintaining target total EC
- Tailor nutrient profiles to specific genetic requirements or growth stages
- Optimize yield and quality for each unique cultivar
3. Troubleshooting Cultivation Issues
EC contribution knowledge serves as a powerful diagnostic tool when facing cultivation challenges.
- Quickly rule out fertigation as a source of plant problems
- Identify inconsistencies in nutrient delivery
- Detect equipment malfunctions or human errors in mixing procedures
By systematically checking EC contributions, growers can isolate and address issues related to nutrient delivery, saving time and resources in the troubleshooting process.
4. Adapting to Variable Water Sources
Advanced application of EC contribution knowledge allows growers to adjust their fertilizer regimes based on source water quality.
- Compensate for existing calcium or magnesium in source water
- Adjust relative EC contributions of fertilizer inputs to maintain optimal nutrient ratios
- Ensure consistent nutrient profiles regardless of water source variations
This flexibility is particularly valuable for operations in areas with fluctuating water quality or for companies managing multiple facilities with different water sources.
5. Maximizing Plant Health, Yield, and Quality
The overarching benefit of mastering EC contributions is the positive impact on overall cultivation outcomes.
- Prevent problems associated with over or under-fertilization
- Maintain consistent nutrient delivery throughout the growth cycle
- Optimize resource use by delivering precisely what plants need, when they need it
While quantitative data may vary depending on specific operations and previous practices, growers implementing rigorous EC contribution management often report:
- Increased crop uniformity
- Improved plant health and resilience
- Enhanced product quality (e.g., flavor profiles, aroma, secondary metabolit content)
- Optimized resource utilization (reduced fertilizer waste)
- Potentially increased yields due to optimized growing conditions
6. Facilitating Precise Crop Steering
Understanding EC contributions is crucial for implementing advanced crop steering techniques.
- Accurately adjust nutrient concentrations to influence plant growth and development
- Implement precise stress techniques to enhance desired plant characteristics
- Maintain tight control over the root zone environment
7. Enhancing Quality Control and Consistency
For commercial operations, consistency is key. EC contribution management supports:
- Standardized procedures across multiple grow rooms or facilities
- Easier training and onboarding of new cultivation staff
- Improved repeatability of successful growth cycles
- More accurate forecasting of crop performance and yield
Conclusion
Understanding and utilizing EC contributions is a tool for precision nutrient management in controlled environment agriculture. By understanding this concept, cultivators can accurately measure and adjust nutrient concentrations, calibrate dosing systems, troubleshoot issues, and optimize recipes for specific cultivars.
EC contribution knowledge enables growers to maintain consistent nutrient delivery throughout the growth cycle, adapt to varying water sources, and implement advanced crop steering techniques. These capabilities translate into improved plant health, optimized resource use, and potentially increased yields and product quality.
A key advantage with Front Row Ag products is the supply chain and manufacturing infrastructure that allows us to provide extremely precise EC contribution numbers for any facility to use.
The principles discussed in this article should be applied to any fertilizer system with the manufacturing control to provide a product with consistent and uniform EC contributions. All cultivators, regardless of their chosen nutrients, should incorporate EC contribution management into their cultivation practices for more precise, efficient, and successful growing operations.


